GBTC Estimator Update

I spent some time this weekend working on my GBTC price predictor. The original idea behind this tool is to take the price action of BTC while the market is closed and use it to predict what will happen to the price of GBTC after the market opens. The original implementation uses the last close price of GBTC, and the price of BTC at the same time, then calculates the premium. It then retrieves the current price of BTC, then uses the calculated premium to determine what the current price of GBTC should be. It’s rather rudimentary, but serves as a quick and dirty calculator.

My hunch is that there are huge arbitrage opportunities to be found within the price action, especially when there are big moves in BTC’s price action. The big unknown, however, is the GBTC premium. The actual underlying value of a GBTC share is 0.009BTC, but the actual trading price fluctuates around 0.0012, so there’s some possibility to take advantage of this spread. We’re talking about the possibility of potential dollars in share price.

GBTC premium. NAV is <0.0009.

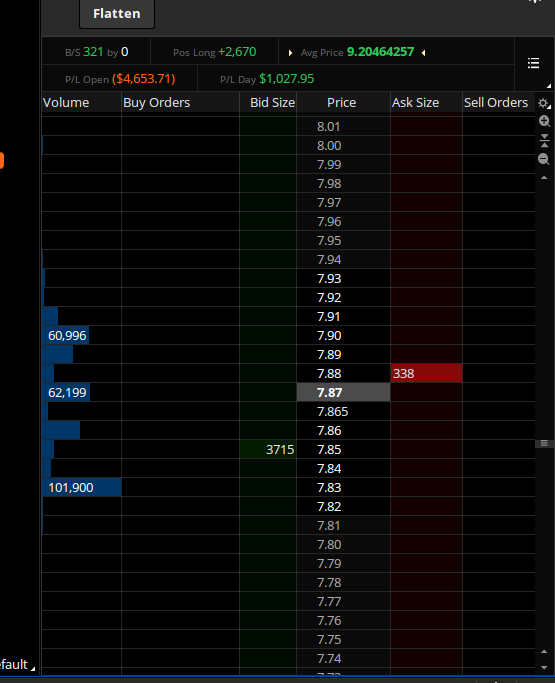
For example this morning, our calculation, based on the price of BTC at $7157, is that GBTC should be at $7.98-8.01 range. Here’s the current premarket spread.

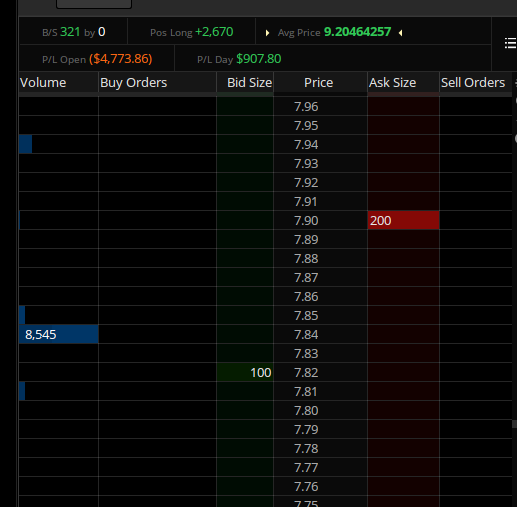
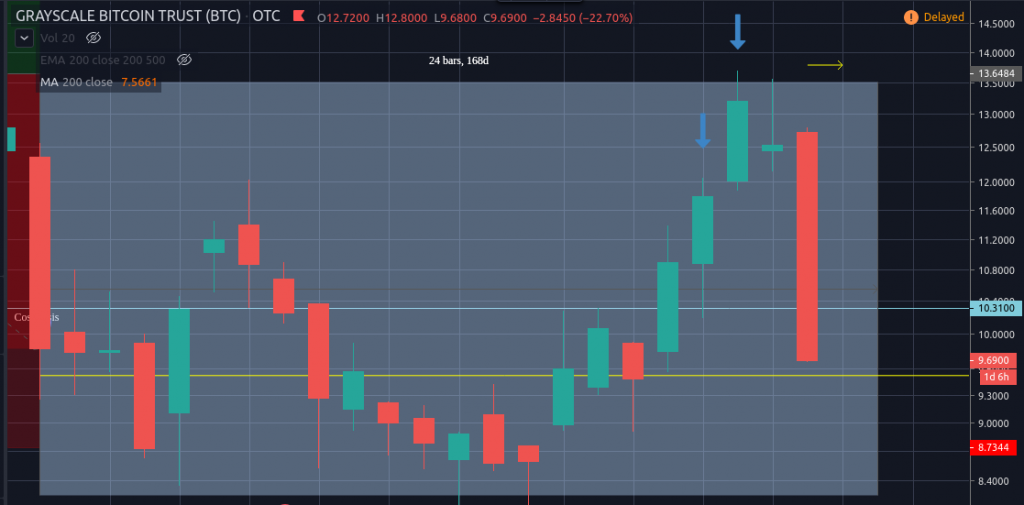
The 7.82 bid order was quantity 800 about half an hour before open. Here’s the chart about five minutes after open.

The difficulty that we’re facing right now is matching the price action between the equity, GBTC, and the underlying crypto, BTC. For our inital purposes, it was enough to use the daily OHLCV data for the equity, and hourly data for the crypto. We only needed to track the crypto price at market close to get our initial premium value. But to do a proper arbitrage bot, we’ll need minute-by-minute data. This presents problems, since all of our work through the TDAmeritrade API has been via the REST API, and this work will involve streaming data via websockets, and likely some async programming.

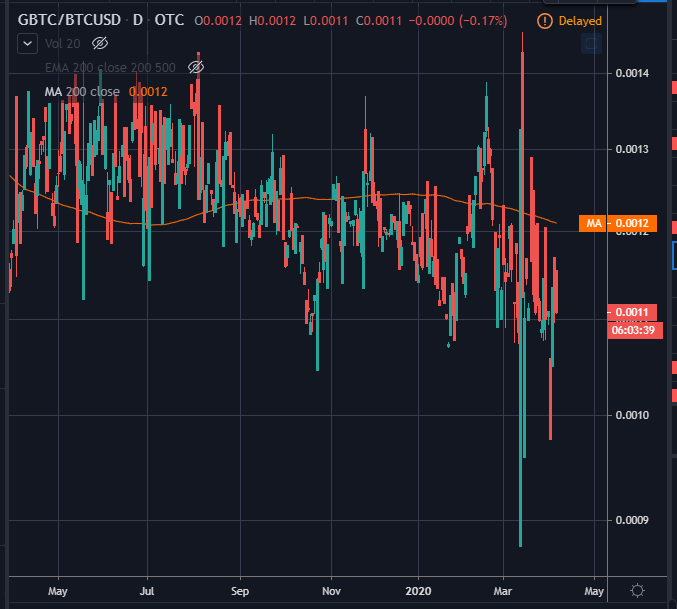
It would be nice to be able to see the intraday price action of the GBTC premium. Right now our free-tier TradingView account only gives us the daily interval, so being able to chart this ourselves is one of our priority. From there we can calculate some sort of moving average and standard deviation to determine when a price is out of band, and represents an arbitrage opportunity. It might be possible to configure something similar with TradingView, but since they don’t support TDA brokerages, we would be subject to a fifteen minute delay on the GBTC data. There’s also the cost factor. As an OTC listing, GBTC trades still have fees associated with them, so any arbitrage situations will have to be large enough to offset the trade.

I’ve got lots of changes that I need to make to the code; right now I’m running into some testing issues related to monkeypatching out the API calls. I’m planning on doing some real time charting using the Bokeh library, and this will have it’s own set of issues, I’m sure.

Bitcoin vs. Coronavirus

It’s no secret that I am a huge bitcoin bull. For all my worries about risk and capital management with my financial investments, both equities and cryptocurrencies, I have thrown caution to the wind as far as bitcoin is concerned. I’d say that roughly two thirds of my total net worth is invested in either bitcoin or GBTC right now. Most of that is held directly in BTC in a hard wallet, and the rest via GBTC in my IRA.

About two months ago I started implementing a value averaging protocol to purchase GBTC. Each Monday, I would gauge the value of my GBTC holdings against a predetermined value, one-twentieth total capital times the number of weeks, and then place a buy or sell order, depending on whether I was above or below the target. The total capital that I planned for this deployment was about a third of my entire portfolio. I had set stops on several of my larger positions to gain cash, many of which triggered during the general market dip in 2019.

For the first fifteen weeks it was straight buy orders. I calculated the price that would trigger my max sell order, and on week eighteen, during the January run up, it triggered. Then the following week, I had a sell order. The last two weeks, as the price oscilated around the $10,000 mark, I was right on target, and didn’t have to place any large orders. During these few weeks, doubt began to creep and I found myself questioning the plan.

What if this was the start of the bull run to $50,000 or higher? Why would I sell? I questioned whether to break the plan and re-enter, or go even further and allocate even more than I had planned originally. I was able to squash this FOMO, and held firm. I had taken some profits, my position was up, and I would have at least another month to buy back in, as my profit taking had decreased my cost basis below my original target.

Weekly chart over the course of value averaging. Blue arrows indicate sell orders. Overall cost basis for period is 9.77/share.

And good thing I did. Effects of the Coronavirus caused a selloff in the markets, and bitcoin has fallen with it, about fifteen percent. I’m still holding to the plan, and will wait until Monday to buy back in. Patience, patience.

Also, I continue to accumulate BTC on a weekly basis, although on a much smaller scale. I’ve written a Python script to purchase a small amount through Gemini and transfer it to my hardware wallet. I’ve got one address for myself, and one for each of my children. The script alternates between them each week, placing buy orders and sending the proceeds to each of our addresses.

I plan on sharing this script via a Git gist or something shortly. It’s part of a larger trade planning library that I’m working on, and I’ve got to triple check that I’m not disclosing anything that shouldn’t be made public. I’ll do the same with the GBTC value averaging results, but that will be more difficult to scrub.

Selling in a bull market

We’re already a week into February; it seems like this year is flying along already. And what a crazy one it is. I’ve been spending a lot of time watching the price of Bitcoin; it seems like the bull market is here and ready to fulfil my dreams of wealth. Also, it seems like Sanders is in position to take the Democratic presidential nomination. On the other hand, Trump just got acquitted by the Senate, and the Democratic party seems to be doing everything they can to fuck things up.

I’ve been very low-key about crypto lately. I don’t talk to people much about in real life. I have fun with it on Twitter, but the fact is that if things go right, I don’t want people to know how much I’m involved with it. Keeping control of your bank is all fun and games until someone gets kidnapped. Someone on Twitter was bragging about being a member of the 10BTC club, and I warned them about OPSEC. They took the tweet down after.

I’ve done my best to protect my holdings. I’ve got redundant hardware wallets plus the private keys protected, but it’s starting to get to the point where I don’t feel entirely safe. I could literally make more from hodling this year than I do at my day job. That’s insane. Many months ago, during the depths of the bear market, I set some dynamic price targets to sell some of my holdings once things took back off using the Mayer Multiple (MM), or the price of BTC as a multiple of its 200-day exponential moving average. I’ve also posted the current MM chart and the TradingView PineScript I used to create it as well.

//@version=1
study("Mayer Multiple", overlay=false)

psma_length = input(100, title="Price SMA Length")
msma_length = input(250, title="Multiple SMA Length")


ma = sma(close, psma_length)
multiple = close / ma
mma = sma(multiple, msma_length)

plot(multiple, title='EMA Multiple', color=#891A0D, linewidth=3)
plot(mma, color=orange, linewidth=2)

Looking at the above chart, one can see that the price of bitcoin has usually peaked when the MM hits 1.9. The winter 2017 bull run peaked just under 2.9x. So a possible strategy would be to start selling as the MM approaches these numbers. I won’t be dumping my holdings at these points, rather I’ll probably start scaling out gradually. I’ve been using a dollar-cost averaging approach, or accumulating, every week, so I think I may start selling the same amount as the price reaches 1.55-1.60x, which is currently $12,900. However, I have made a decision to sell a significant portion of my holdings if we reach 2.88 like we did at the end of the last bull run. That would be just under $24,000. Of course those numbers are dynamic and will likely be much bigger if we take our time to get there. Otherwise, I assume we’ll have some sort of blow off top with opportunity to buy back in later.

I truly believe that Bitcoin represents the greatest financial opportunity that I’ve seen in my lifetime, and one of the main difficulties I’m struggling with is how to balance my risk. I’ve already got a majority of my net worth in crypto, and the temptation to go even further is strong. I’ve written about GBTC in the past; in the next week I’ll complete a 20-week value-averaging plan that I’ve been executing. It’s just hit it’s max payout target for the first time, and we are fully in the black. More about that next week.

That said, it’s hard finding a sell strategy. The important thing is to have a plan, and having the discipline to execute it. My hope is that I can use some of the longer-term trend indicators to build a cash reserve that I can redeploy during the next bear market. If we’re setting up for another multi-year parabolic bull run, then I want to make sure that I take profits and do so slowly enough that I don’t miss too much of the top.

Estimating GBTC price from BTC after-hours activity

Grayscale Bitcoin Trust (GBTC) is the name of a publicly traded OTC investment product listed on the public OTC markets. It’s a way for US investors to take a position in Bitcoin through brokerage and retirement accounts like IRAs. A lot of OG crypto-types scoff at the prospect of purchasing such an asset, since you don’t actually control the BTC or the private keys, but for some this is an attractive option, or an only one. I’ve been personally taking positions in GBTC over the past 3 or so years through my retirement IRA. One of the most underlooked qualities of GBTC through an IRA is that all transactions are tax-free. I can take profits in my IRA at any time without worrying about tax liability, which is not something I can say for my actual crypto holdings.

Two of the downsides of GBTC is that Grayscale takes a two percent management fee. This isn’t a big deal to me because of the expected gains in a bull run. The other is that there is a premium on GBTC over the underlying asset value. Each share of GBTC represents .00096884 Bitcoin, but the GBTC’s price is usually 30-10% higher than the value of the underlying asset.

One of the main differences between the equities and crypto markets is the fact that crypto is 24/7. Often, during times when BTC has made a big price movement, I’ve wondered what the corresponding change in the price of GBTC would be (and in my portfolio!) So, I have written a small Python package to calculate this that I call GBTC Estimator.

I have it setup to get public BTC prices from Gemini (via the excellent CCXT package). Right now it’s using IEX’s daily GBTC data (and required an IEX API key), so it only has access to daily OHLCV (open, high, low, close, volume) data. We take the close price of GBTC, and divide it by the price of BTC at the same time (4PM EST) to come up with the actual BTC per share. This number is then used with the current BTC price to come up with the estimated GBTC value.

This current version is run from the command line and returns the estimated price as well as the difference from the last close in dollars and percentage. I have plans to put this up as a website that updates automatically, but first I think I’m going to do some backtesting to see how accurate this is. I think there may be some arbitrage opportunities to be found here. I’ve already started refactoring and will have more updates to follow.